
Financial performance serves as the backbone of any thriving healthcare organization. For medical practices across the country, knowing how much revenue flows in with each patient visit reveals critical insights about overall financial health.
Among all the metrics that matter in revenue cycle management, Average Revenue Per Encounter (ARE) stands out as one of the most telling indicators of your practice’s true financial picture.
Think of ARE as your financial compass, it points you toward what’s working and what needs attention in your revenue cycle. Unlike other metrics that show you how quickly you collect money or how many claims get denied, ARE cuts straight to the heart of the matter. How much actual revenue you’re generating per patient interaction.
What is Average Revenue Per Encounter?
Average Revenue Per Encounter measures the average amount of revenue your healthcare practice actually collects for each patient visit, regardless of what you initially bill. This distinction matters enormously because there’s often a significant gap between what providers charge and what they actually receive in payment.
The formula couldn’t be simpler:
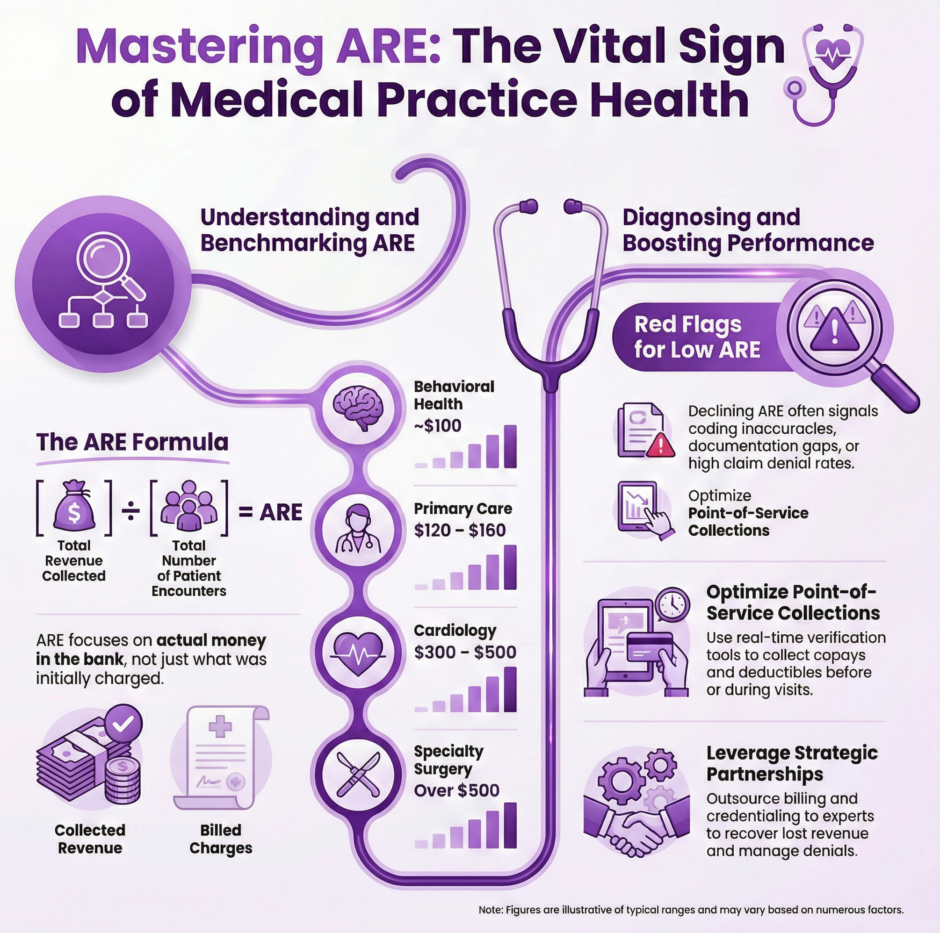
Total Revenue Collected ÷ Total Number of Patient Encounters = ARE
Consider this real-world example: Your practice collected $90,000 in revenue last month from 600 patient visits. Your ARE would calculate to $150 per encounter ($90,000 ÷ 600 = $150). This means each visit, on average, brings in $150 of actual collected revenue, a concrete measure of your practice’s revenue efficiency.
What makes ARE so valuable is its focus on collected revenue rather than billed charges. You might bill $200 per visit, but if insurance reimbursements, patient payments, and collection efforts only net you $150, then your ARE accurately reflects that reality. This metric doesn’t lie or paint a rosier picture than what’s actually happening in your bank account.
Why Every Healthcare Practice Should Track ARE
 Monitoring ARE monthly provides both a snapshot of current performance and a trendline showing where your practice is heading financially. While other key performance indicators like Days in Accounts Receivable or Net Collection Rate show how well you manage cash flow timing, ARE tells you how much revenue you’re actually earning per unit of care delivered.
The importance of ARE extends far beyond simple bookkeeping. This metric serves as an early warning system for potential problems and a guide for strategic decision-making. When ARE starts declining, it signals that something in your revenue cycle needs attention, whether that’s coding accuracy, payer contract terms, or collection processes.
Identifying Medical Billing and Coding Issues
ARE acts as a diagnostic tool for billing and coding problems. If your coding is incomplete, inaccurate, or outdated, your revenue per encounter will drop regardless of how many patients you see. A declining ARE often flags potential underbilling situations or missed opportunities for appropriate reimbursement.
For instance, if your practice typically sees an ARE of $180 but it drops to $160 over several months, that $20 difference per encounter adds up quickly. With 500 encounters per month, you’re looking at $10,000 in lost revenue monthly, or $120,000 annually.
Revealing Payer Mix Challenges
The types of insurance plans your patients carry directly affect your revenue per encounter. Commercial insurance typically reimburses at higher rates than Medicare or Medicaid. A drop in ARE might indicate that your patient population has shifted toward lower-paying insurance plans, or that commercial payers have reduced their reimbursement rates.
This insight becomes crucial for strategic planning. If you notice ARE declining due to payer mix changes, you might need to evaluate your participation in certain networks, renegotiate contracts, or adjust your patient acquisition strategies.
Highlighting Operational Inefficiencies
When different providers within your practice see similar patient volumes but generate vastly different ARE figures, that’s a clear signal to examine workflows, documentation practices, or coding habits. These variations often reveal opportunities for improvement and standardization across your practice.
Connecting Revenue to Patient Care Quality
When ARE drops too low, it creates a cascading effect throughout your practice. Reduced revenue per encounter strains resources, limits reinvestment in staff and technology, and can ultimately impact the quality of patient care you’re able to provide. Maintaining healthy ARE levels ensures you have the financial foundation needed to deliver excellent patient experiences.
Industry Benchmarks: Where Should Your ARE Stand?
Unlike some standardized healthcare metrics, ARE doesn’t have universal benchmarks because it varies significantly based on specialty, procedure types, and regional payer contracts.
However, general ranges can provide useful context:
- Primary care practices typically see ARE between $120-$160
- Cardiology groups might expect $300-$500
- Behavioral health clinics often average around $100
- Specialty surgical practices frequently exceed $500
The key isn’t necessarily hitting a specific number, it’s about trending and comparison. If your ARE has dropped 10% over six months, that warrants investigation regardless of your specialty. Similarly, if your ARE consistently falls below your specialty’s typical range, you’re likely leaving money on the table.
Common Culprits Behind Low ARE Performance
When ARE declines or remains consistently low, it usually signals deeper revenue cycle problems. Identifying these root causes helps target improvement efforts effectively.
- Coding Accuracy Issues top the list of ARE problems. When diagnosis or procedure codes are missing, incomplete, or outdated, reimbursement suffers. This includes failing to use the most specific codes available or not capturing all billable services provided during an encounter.
- Suboptimal Payer Contracts can significantly drag down ARE. If you haven’t renegotiated insurance contracts recently, you might be stuck with below-market reimbursement rates while your costs continue rising. Some practices discover they’re accepting contracts that barely cover their costs per encounter.
- Documentation Deficiencies create a domino effect on revenue. When physicians and clinical staff don’t document services thoroughly, it leads to downcoded claims or services that aren’t reimbursed at all. The adage “if it wasn’t documented, it wasn’t done” applies directly to revenue capture.
- High Denial Rates erode ARE when claims get rejected and aren’t appealed or corrected promptly. Even if you see the same number of patients, denied claims that remain unresolved mean lost revenue that never gets collected.
- Patient Collection Shortfalls impact ARE when practices fail to collect copays, deductibles, or patient balances at the point of service. Patient accounts that age become increasingly difficult to collect, effectively reducing the revenue realized per encounter.
Strategic Approaches to Boost Your ARE
Improving ARE requires a systematic approach that addresses multiple aspects of your revenue cycle. The good news is that ARE can be improved with the right strategies and consistent implementation.
Coding Excellence Through Regular Audits
Regular coding audits ensure that your medical coding accurately reflects the complexity and scope of care provided. This might involve investing in additional training for your staff or partnering with certified medical coders who specialize in your practice area. The investment in coding accuracy typically pays for itself through improved reimbursements.
Documentation Optimization
Training providers to document with medical necessity and payer requirements in mind makes a significant difference in ARE. Electronic health record templates and prompts can guide complete documentation without sacrificing efficiency or patient interaction time.
Payer Mix Analysis and Contract Management
Use data analytics to regularly assess your patient population and payer contracts. Identify which insurance companies consistently underpay and which plans offer fair reimbursement. This analysis provides leverage for contract renegotiations and helps inform decisions about network participation.
Point-of-Service Collection Enhancement
Real-time insurance verification and patient responsibility estimation tools help collect balances upfront. Digital payment options improve both convenience for patients and collection rates for practices. When patients know their financial responsibility before or during their visit, collection rates improve significantly.
Performance Monitoring and Trending
Track ARE monthly across multiple dimensions:
- By individual provider
- By practice location
- By insurance company or payer type
- By service or procedure type
This granular analysis helps identify performance gaps quickly, allowing for targeted corrective actions rather than broad, unfocused improvements.
Data-Driven Decision Making with ARE
ARE becomes most powerful when analyzed alongside other revenue cycle metrics.
Consider these complementary indicators:
- Days in Accounts Receivable – Shows how quickly you collect
- Accounts Receivable over 120 days – Indicates collection challenges
- Denial rate – Reflects claim accuracy and payer relations
- Gross and net collection rates – Show overall collection efficiency
When ARE trends downward while denial rates increase, focus on claims management and coding accuracy. If ARE remains flat while patient volumes grow, you likely have payer mix or service pricing issues that need attention.
The Strategic Partnership Advantage
Many practices find that improving ARE requires expertise and resources beyond their internal capabilities. This is where strategic partnerships become valuable. Working with specialized revenue cycle management companies provides access to advanced tools, experienced staff, and proven processes that can lift ARE without increasing internal workload.
These partnerships typically offer services that directly impact ARE:
- Eligibility verification to reduce denials and improve patient collection
- Certified medical coding to ensure accurate, compliant, and complete coding
- Claims scrubbing to catch errors before submission
- Active insurance follow-up to accelerate payments
- Structured denial management to recover lost revenue
- Professional patient collection services to improve payment rates
The right partner brings both tactical execution and strategic insights, helping practices not just improve ARE but maintain those improvements over time.
Summary: ARE is a Sign of Your Financial Health
![]() Average Revenue Per Encounter serves as a vital sign for your practice’s financial health. Like blood pressure or pulse rate for patient health, ARE provides immediate feedback about how well your revenue cycle is performing and early warnings when problems develop.
Average Revenue Per Encounter serves as a vital sign for your practice’s financial health. Like blood pressure or pulse rate for patient health, ARE provides immediate feedback about how well your revenue cycle is performing and early warnings when problems develop.
For healthcare practices ready to optimize their financial performance, focusing on ARE improvement delivers measurable results. Whether through internal process improvements or strategic partnerships, the investment in ARE optimization typically pays significant dividends in practice sustainability and growth.
At Medwave, we recognize that achieving optimal ARE requires more than just good intentions, it requires expertise in billing, credentialing, and payer contracting that directly impacts your revenue per encounter.